Plot in the dialog box
This example demonstrates how to create and display a plot within a dialog box using matplotlib and mpld3.
The plot is generated as an HTML component and embedded into a dialog box, which can be used for testing or user interaction purposes.
The process involves generating a plot using matplotlib, converting it to HTML using mpld3, and then embedding the HTML into a dialog box.
This approach is particularly useful for scenarios where visual data needs to be presented to the user or tester in an interactive manner.
how to start
- Launch
hardpy init html_plot. - Install Required Packages
pip install matplotlib mpld3. - Create your
test_plot.pyfile with the test case. - Launch CouchDB instance.
- Launch
hardpy run html_plot.
test_plot.py
The following code demonstrates how to create a simple plot and display it in a dialog box:
import matplotlib.pyplot as plt
import mpld3
import pytest
from hardpy import DialogBox, HTMLComponent, run_dialog_box
pytestmark = pytest.mark.module_name("Dialog box with HTML")
@pytest.mark.case_name("Base dialog box with html code")
def test_dialog_box_with_html_code():
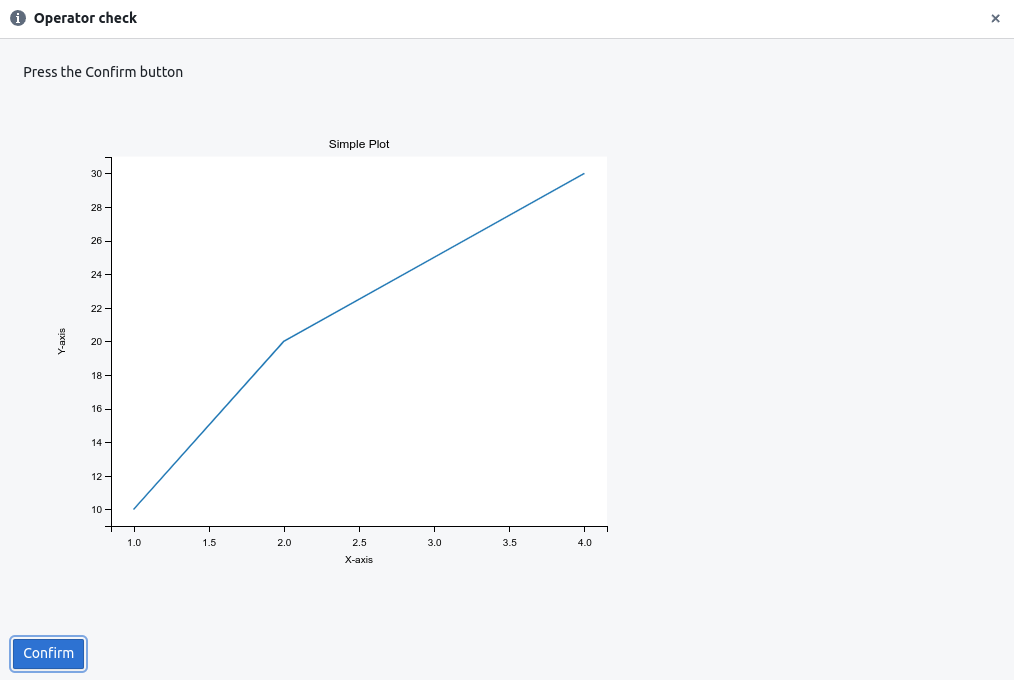
fig, ax = plt.subplots()
ax.plot([1, 2, 3, 4], [10, 20, 25, 30])
ax.set_xlabel("X-axis")
ax.set_ylabel("Y-axis")
ax.set_title("Simple Plot")
test_html = mpld3.fig_to_html(fig)
dbx = DialogBox(
title_bar="Operator check",
dialog_text="Press the Confirm button",
html=HTMLComponent(html=test_html, is_raw_html=True),
)
response = run_dialog_box(dbx)
assert response