HardPy panel
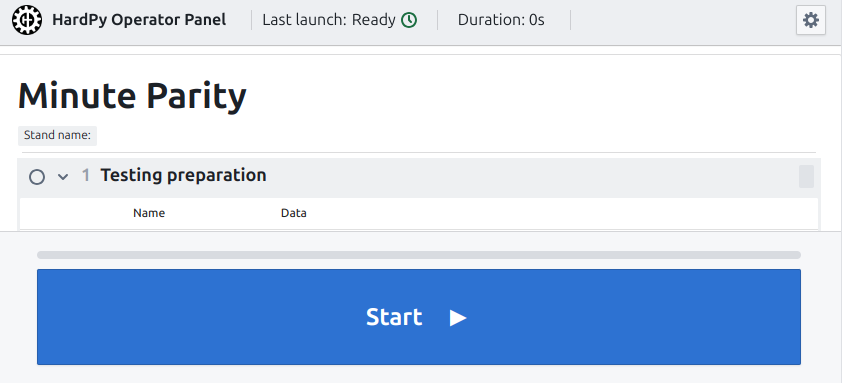
The hardpy panel or operator panel is a web interface that displays and controls the testing process in HardPy.
Capability
HardPy panel allows you to:
- Start and stop testing;
- Interact with dialog box during testing;
- Browse:
- Test suite name.
- Last test run status.
- Test module name.
- Duration of test modules execution.
- Test module status.
- Test case name.
- Test case message.
- Test case status.
- Browse current statestore state in debug mode.
Languages
You can set one of the following operator panel languages via the configuration file:
- English ("en")
- German ("de")
- French ("fr")
- Spanish ("es")
- Chinese ("zh")
- Japanese ("ja")
- Russian ("ru")
- Czech ("cs")
Usage
Launch operator panel
Use the hardpy run command to start the web server. After this open page http://localhost:8000/ in the browser.
When the operator panel is running, you can run tests through the web interface or through the pytest launcher (in a terminal or from another application).
Start and stop tests
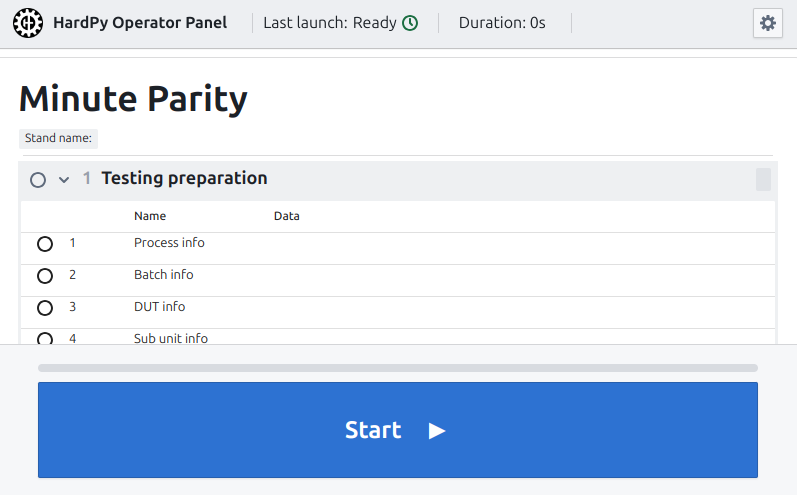
The operator panel contains a test start/stop button in the lower right corner of the screen. The user can start/stop tests using the space key.
Operator panel bar
Operator panel bar displays key system status information in a compact tag-based format.
Fields:
- Stand name - name of the test stand;
- Status - current system status;
- Start time - test/operation start timestamp with timezone;
- Finish time - completion timestamp with timezone;
- Alert - active warning or error message;
- Test stand info - additional test stand parameters from set_dut_info info;
All fields appear as minimal tags and only display when data is available.
Settings
The operator panel contains a setting button in the top right corner.
debug mode
The user can view the statestore database online by clicking on the Turn on the debug mode button.
Debug mode is disabled by default.
sound
The user can turn on the sound of the end of the test by clicking on the Turn on the sound button.
Sound can also be enabled by setting sound_on = true in the frontend configuration section.
Sound is disabled by default.
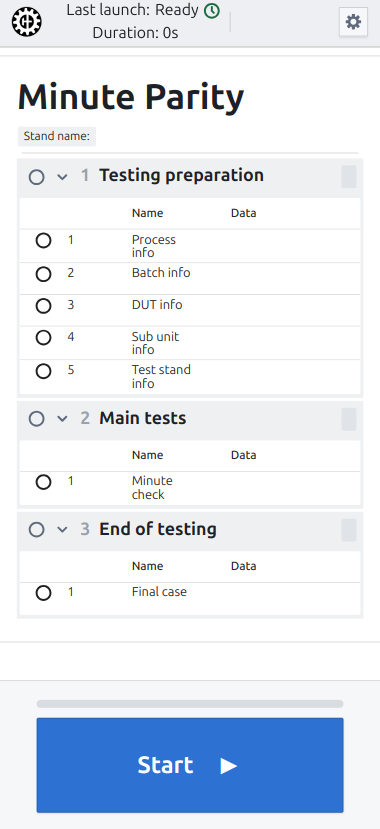
Full-size start/stop button
The operator panel supports a full-size start/stop button layout for improved usability in various scenarios. This feature is particularly useful for:
- Touchscreen interfaces
- Mobile devices
- Situations requiring prominent control elements
Configuration:
Enable the full-size button in your hardpy.toml:
[frontend]
full_size_button = true
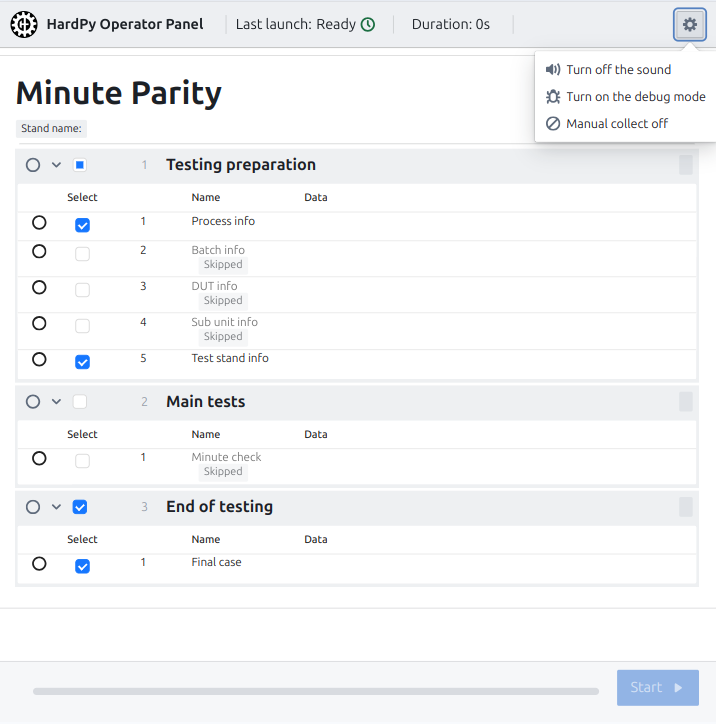
Manual test selection
The operator panel supports manual test selection, allowing operators to choose specific test cases to run instead of executing the entire test plan.
Features:
- Checkbox Interface: Each test case displays a checkbox for selection in the test suite view.
- Bulk Selection: Checkboxes at the module level allow selecting/deselecting all tests in a module.
- Visual Indicators: Selected tests are displayed normally, while non-selected tests are visually muted and marked as
Skipped.
Usage:
- Enable manual collect mode in your
hardpy.toml:
[frontend]
manual_collect = true
- When the operator panel loads, enable Manual collect on in the settings menu - checkboxes will appear next to each test case and module
- Select the desired tests by checking the corresponding checkboxes
- Disable manual collect mode by selecting Manual collect off in the settings menu
- Click the start button to run only the selected tests (non-selected tests will be skipped)
Note: When manual collect mode is disabled (default), all tests are selected and the checkboxes are hidden.
Dialog box
For user interaction with the test, it is possible to use dialog boxes. An example of usage can be seen in the example dialog box and in dialog box documentation. Currently, there are some types of dialog boxes.
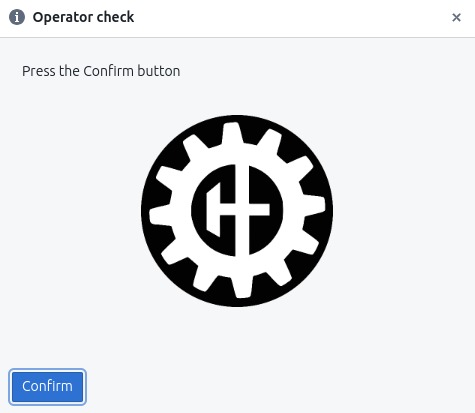
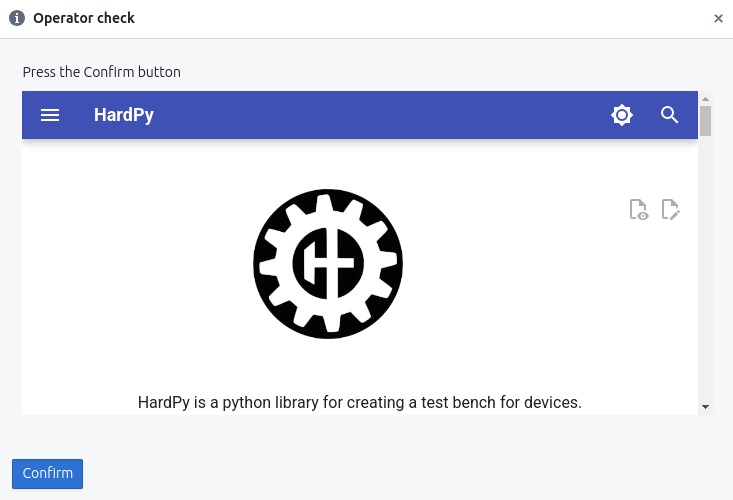
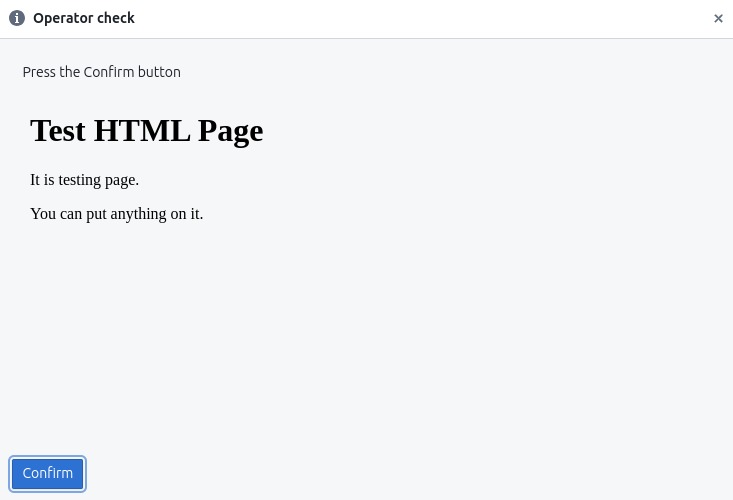
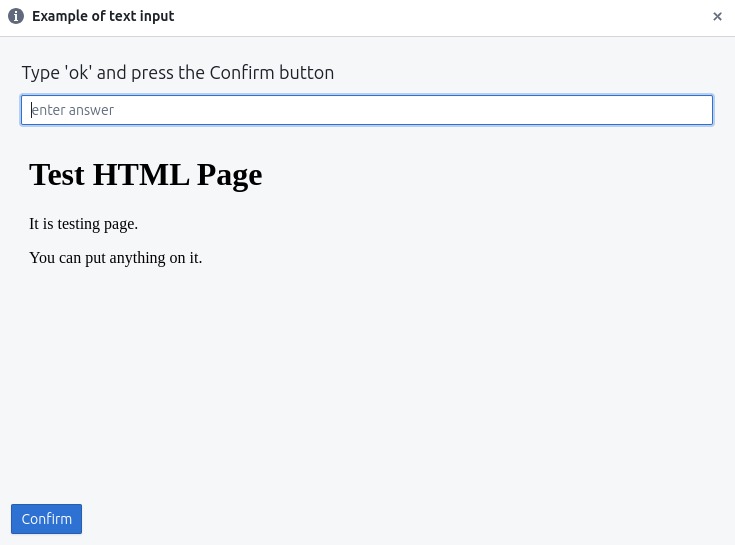
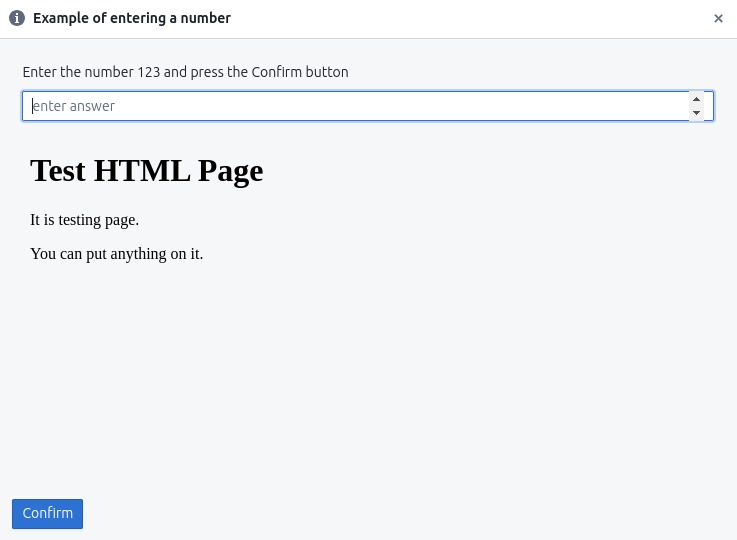
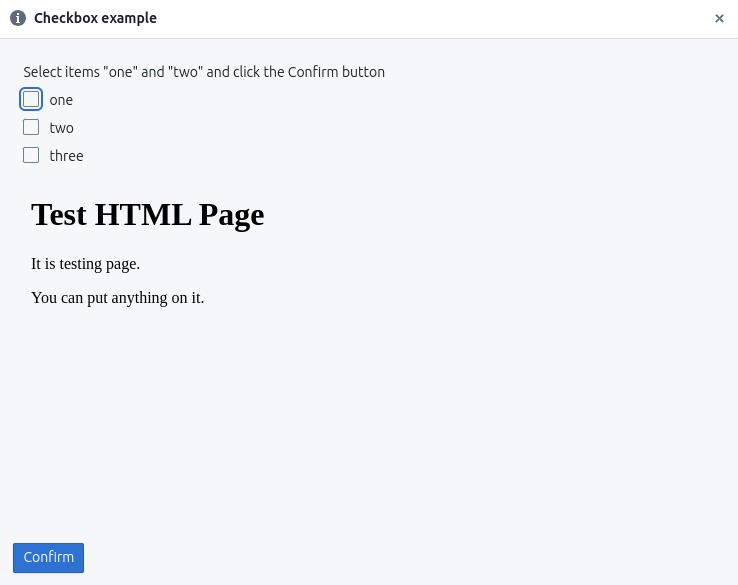
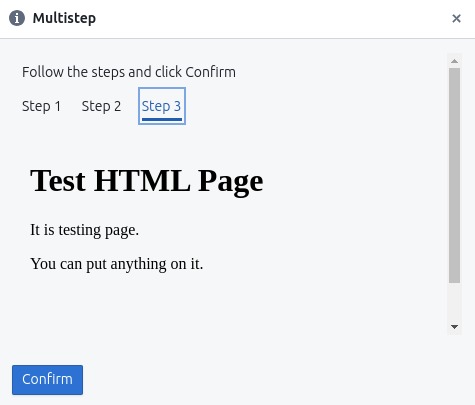
Each dialog box can contain an image, HTML page or pass/fail buttons.
- Allows the width to be changed using the
widthparameter. - Allows changing the border thickness with the
borderparameter. - Allows the following image types: gif, jpeg, pjpeg, png, svg+xml, tiff, vnd.microsoft.icon, vnd.wap.wbmp, webp.
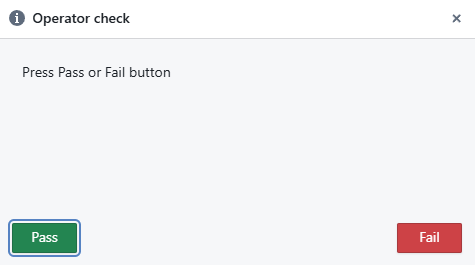
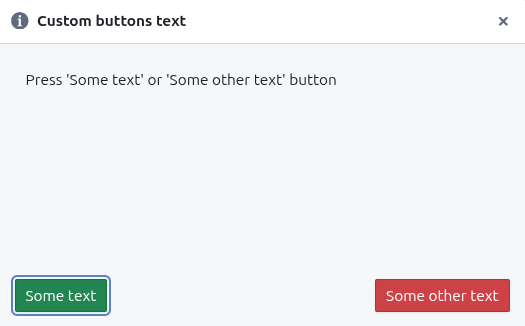
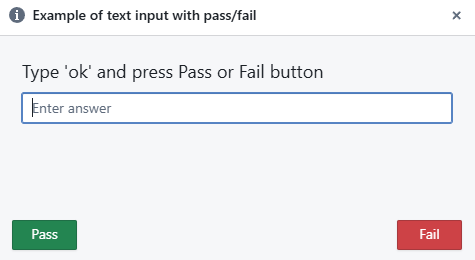
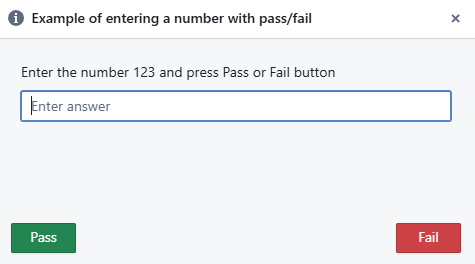
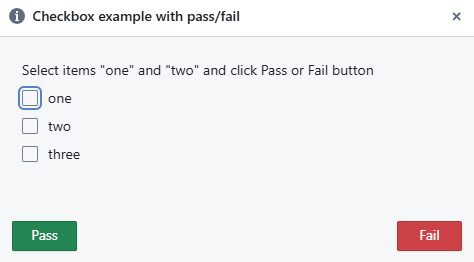
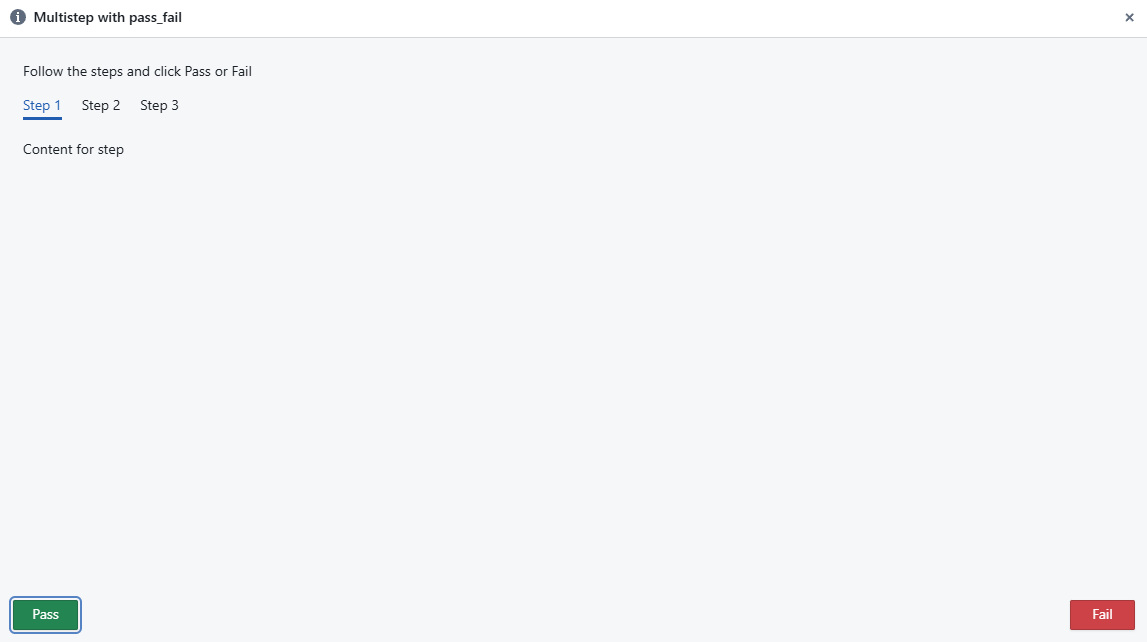
- Allows to use one or two buttons (
pass/failbutton). - Allows to set custom button names via the
button_textparameter.
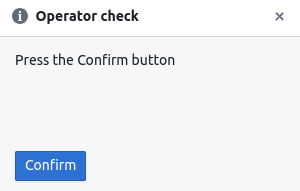
basic dialog box
Contains an instruction or question and a confirm button for confirmation.
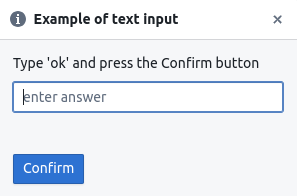
text input field
Contains an instruction or question, a text input field, and a confirm button for confirmation.
The text is transmitted in UTF-8 encoding.

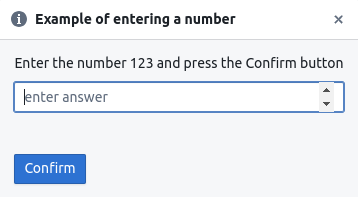
number input field
Contains an instruction or question, a number input field, and a confirm button for confirmation.
- Allows float numbers with a dot separator.
- Allows negative numbers.
- Allows numbers to be entered using E notation with
e, e.g.2e3. - The entered numbers will be converted to float.

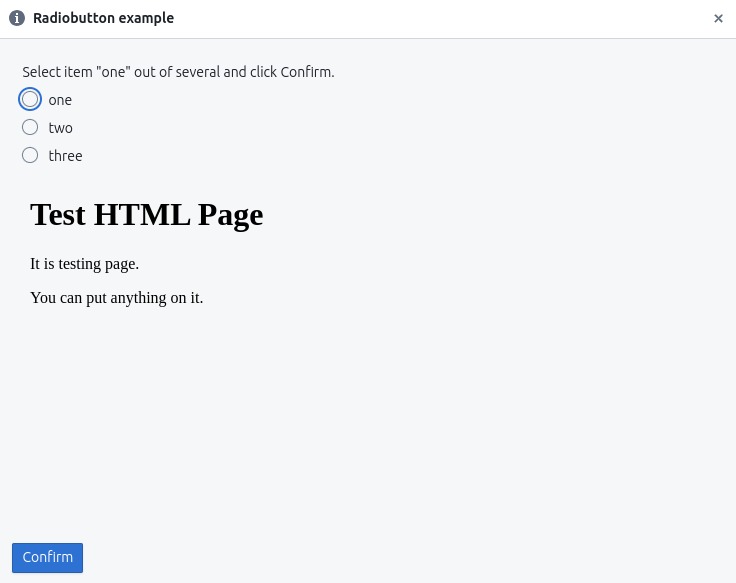
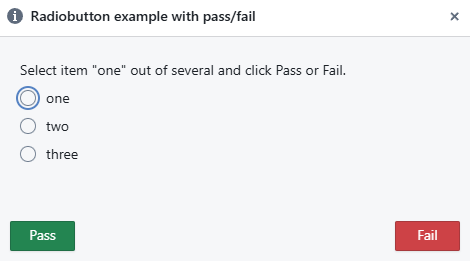
radiobutton
Contains radiobutton widget.
- The user selects one option from several possible ones.
- Returns the contents of the selected item as a string.


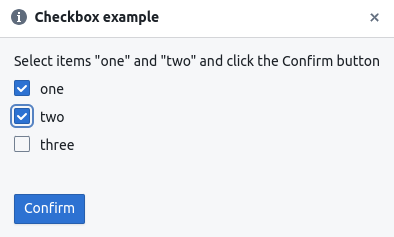
checkbox
Contains checkbox widget.
- The user selects several options from several possible ones.
- Returns a list with the contents of the selected items.

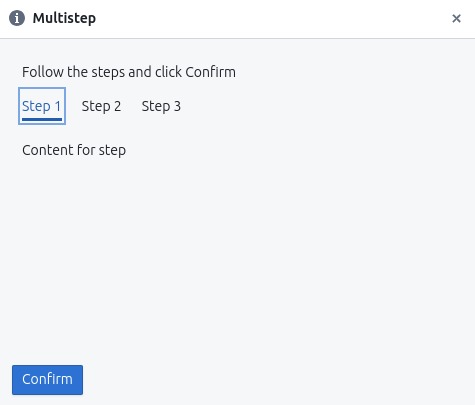
multiple steps
Contains an instruction with multiple steps and confirm button for confirmation.
Allows steps with text and image.

Operator message
The messages to the operator are similar to dialog boxes,
but do not contain a Confirm button and can be called outside
the execution of the test plan, for example in case of exception
catching in the conftest.py file.
For more information, see the example operator message
or in the function description set_operator_message.
warning window
If the user clicks confirm without entering anything, a warning window will be displayed.

error notification
If the user closes the dialog box (using the cross in the upper right corner), the tests will be stopped, an error message will be displayed.

Charts
For visualizing test data, it is possible to use interactive charts. Charts provide a graphical representation of measurement results and allow operators to analyze data trends in real-time.
Charts support the following features:
- Multiple datasets on a single chart
- Zooming capabilities
- Logarithmic scales for both X and Y axes
- Collapsible/expandable view
Basic line chart
Displays a single dataset as a line chart with customizable styling.
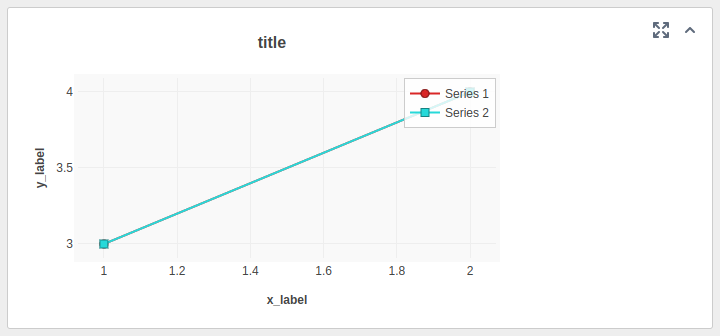
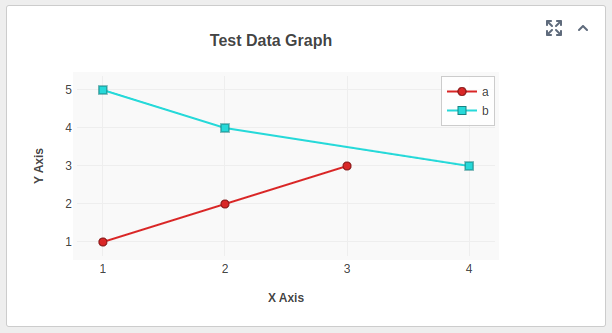
Multiple datasets
Shows multiple datasets on the same chart for comparative analysis. Each dataset can have different colors and styles.
Collapsed view
Charts can be collapsed to save screen space when not actively being analyzed.

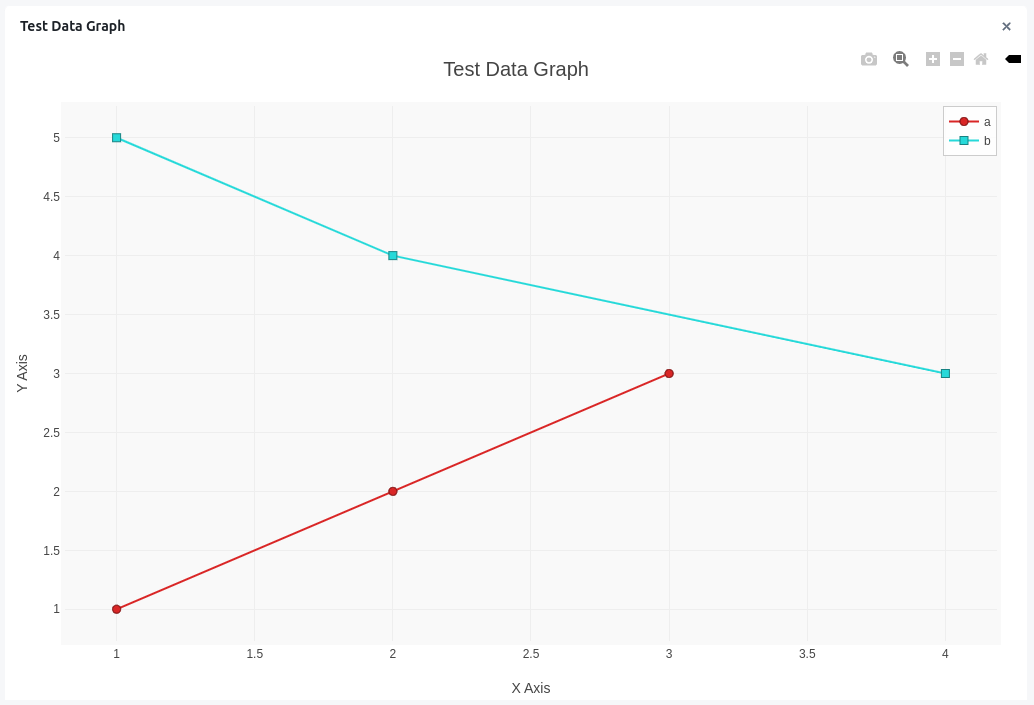
Expanded view
Charts can be expanded to full view for detailed analysis.
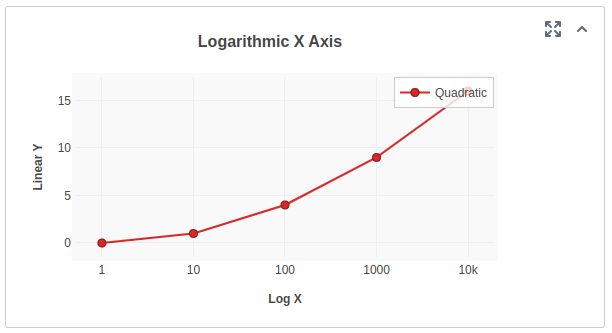
Logarithmic X-axis
When dealing with data that spans multiple orders of magnitude, the X-axis can be set to logarithmic scale.
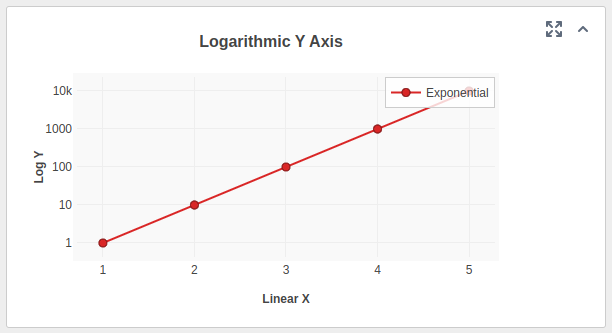
Logarithmic Y-axis
The Y-axis can be set to logarithmic scale for better visualization of exponential data trends.
Logarithmic X and Y axes
Both axes can be set to logarithmic scale for data that requires logarithmic representation in both dimensions.
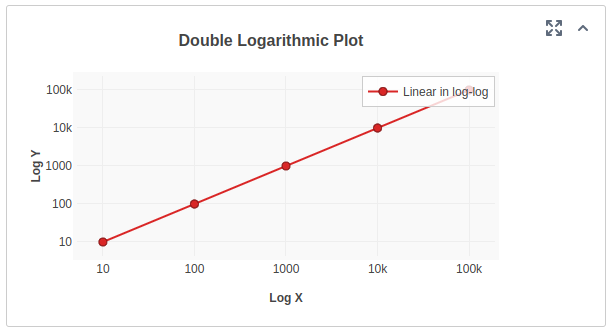
Chart interaction
- Zoom: Click and drag to select an area to zoom into
- Pan: Click and drag to move around the chart when zoomed in
- Reset zoom: Double-click to reset to the original view
- Data points: Hover over data points to see exact values
- Legend: Click on legend items to show/hide specific datasets
- Download: Downloading plot as a PNG.
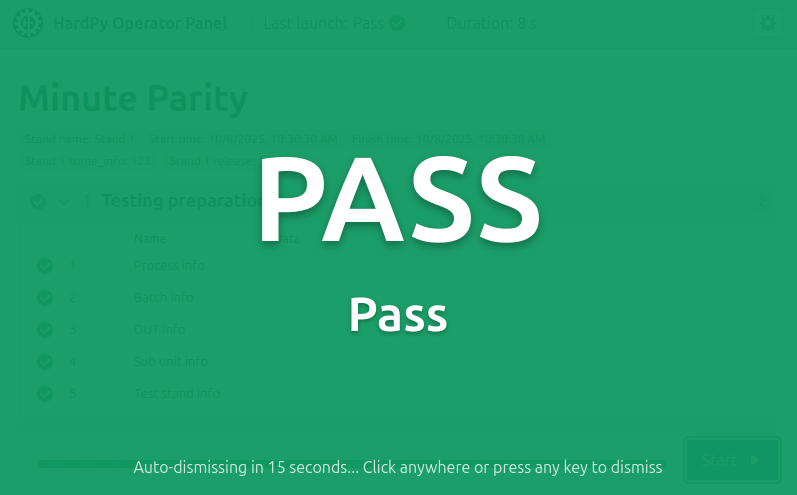
Test completion modal results
The operator panel now displays comprehensive test completion results through modal windows that provide immediate visual feedback about test outcomes.
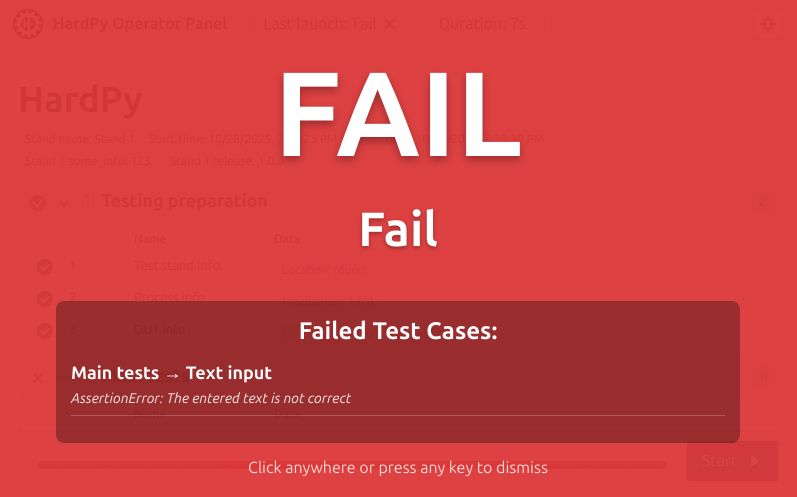
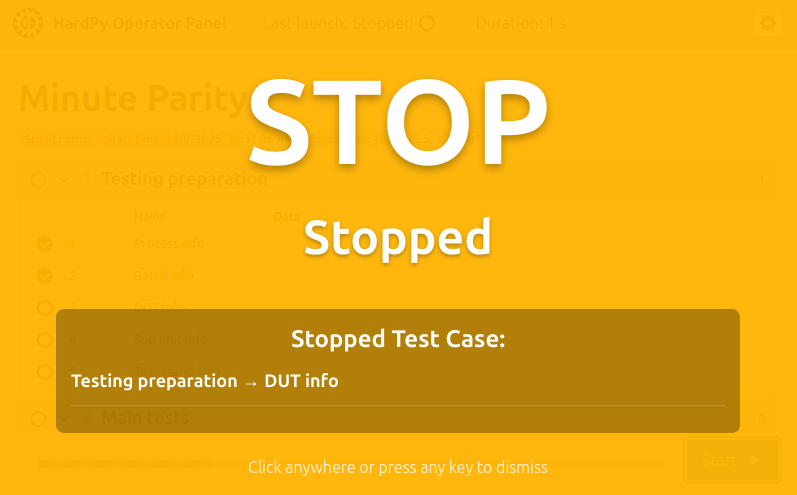
Modal types:
- PASS Modal: Green background with auto-dismiss countdown timer
- FAIL Modal: Red background with scrollable list of failed test cases including module names, test case names, and assertion messages
- STOP Modal: Yellow background showing the stopped test case details
User interaction:
- Auto-dismiss: PASS modals automatically close after a configurable timeout (default: 5 seconds)
- Manual dismissal: Click anywhere on the modal or press any key to close
- Space key protection: Prevents accidental test start/stop during modal display
- Cooldown period: Brief delay after modal dismissal before space key actions are enabled
Configuration:
Enable and customize modal results in your hardpy.toml:
[frontend.modal_result]
enable = true
auto_dismiss_pass = true
auto_dismiss_timeout = 15